Commercial/Multifamily Market Intelligence Blog
-
 Chart of the Week: Total Commercial Real Estate lending, 2020-2024
From 2020 to 2024, commercial and multifamily mortgage originations experienced notable shifts across investor types. The market peaked in 2021, driven by heightened activity across nearly all sectors, before experiencing a sharp decline in 2023. A modest rebound followed in 2024.
-
 Chart of the Week: Commercial/Multifamily Mortgage Debt Outstanding
Total commercial and multifamily mortgage debt outstanding increased by 3.7% year-over-year, rising from $4.62 trillion in Q4 2023 to $4.79 trillion in Q4 2024. This growth reflects continued investment in commercial real estate, with sector-specific variations in debt allocation.
-
 Chart of the Week: Commercial Real Estate Loan Maturity Volumes
Twenty percent ($957 billion) of $4.8 trillion of outstanding commercial mortgages held by lenders and investors will mature in 2025, a 3 percent increase from the $929 billion that matured in 2024, according to the Mortgage Bankers Association’s 2024 Commercial Real Estate Survey of Loan Maturity Volumes.
-
2024 Q3 Databook
The US economy continued its hot streak during the third quarter. Real gross domestic product grew at a real seasonally adjusted annual rate (SAAR) of 3.1 percent, following a rise of 3.0 percent in Q2. Consumers were key to the growth, with personal consumption growing at a real SAAR of 3.7 percent. Growth in business investment in equipment and intellectual property slightly outpaced the fall-off in investment in residential and non-residential property.
-
2024 Q2 Databook
After growing at a seasonally adjusted annual rate of 1.4 percent during the first quarter of 2024, the US real gross domestic product grew at 3.0 percent during the second quarter. The growth was driven by increases in consumer spending, private inventory investment, and nonresidential fixed investment.
-
 Chart of the Week: State and Local Building Performance Standards
Efforts to reduce carbon emissions related to commercial real estate have gone local, with the Biden Administration establishing a National Building Performance Standards (BPS) Coalition to help promote and facilitate state and municipal action.
-
2024 Q1 Databook
The US economy continues to show strength, albeit with (long-expected) moderation in some areas. Real gross domestic product grew at a seasonally adjusted annual rate of 1.3 percent in Q1, down from 2023 growth rates of 2.2 percent in Q1, 2.1 percent in Q2, 4.9 percent in Q3 and 3.4 percent in Q4. Consumer spending on services continued to be a key driver – growing at a 3.9 percent real annual pace during Q1. Consumer spending on goods fell at a 1.9 percent pace.
-
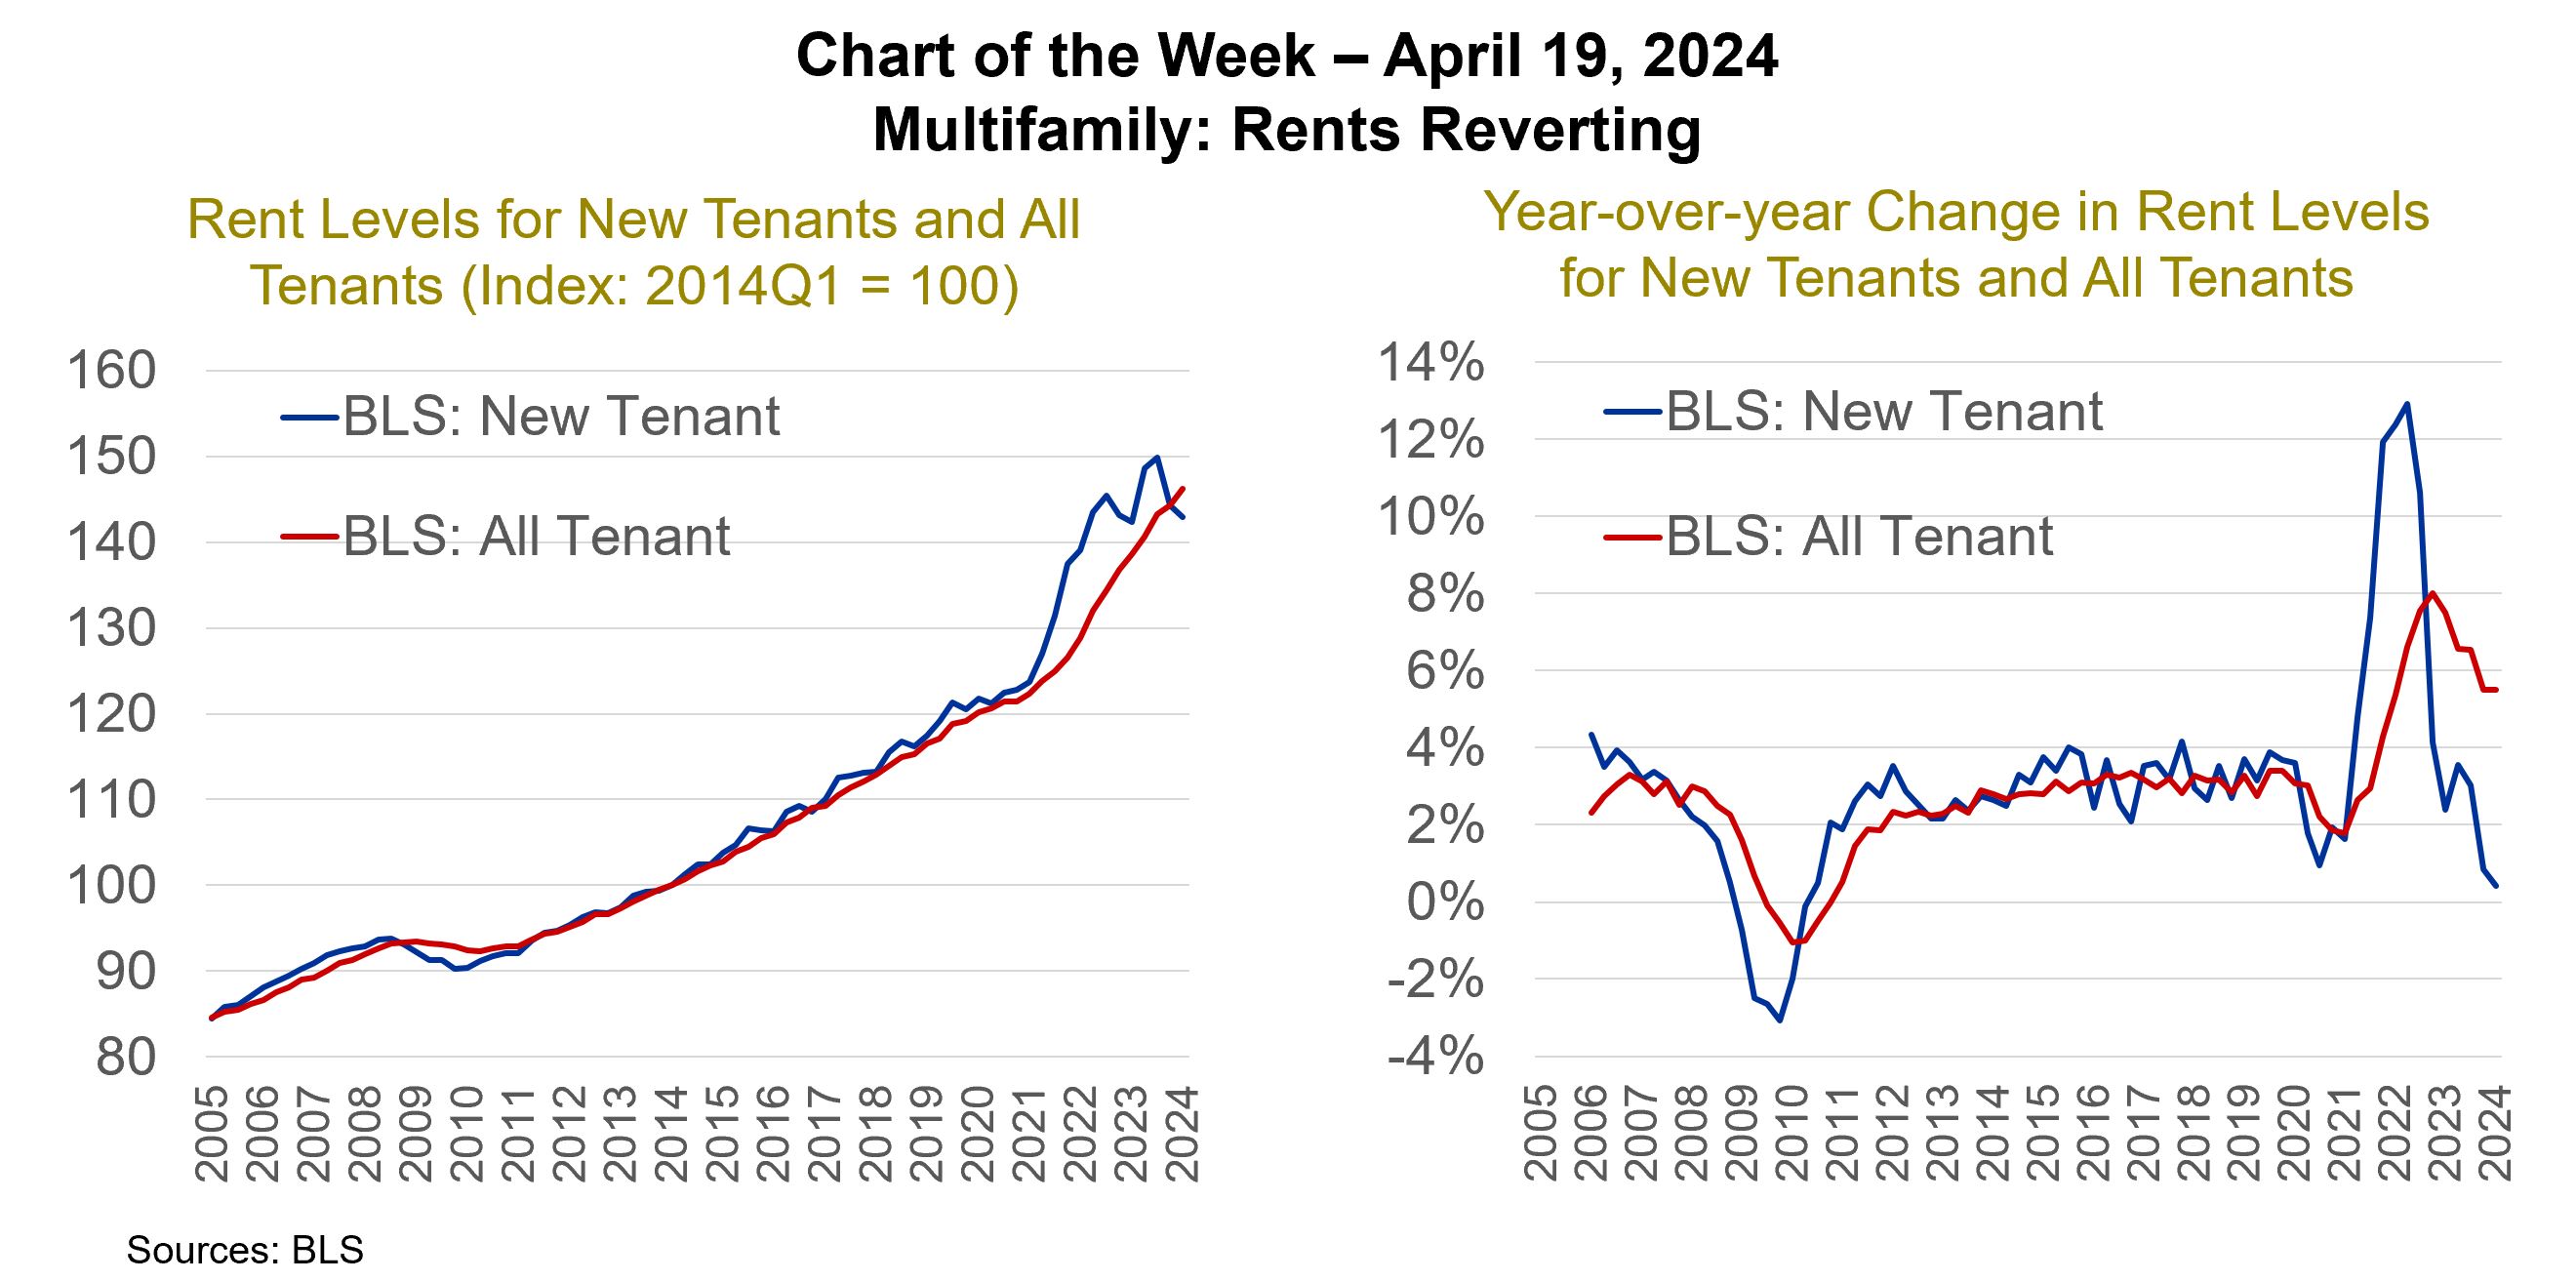 Chart of the Week: Multifamily - Rents Reverting
The pandemic did a number on the housing market. Rental markets were already stretched from years of underdevelopment that followed the Great Financial Crisis, while a surge of Millennials was just entering their formative renting years. The result was falling multifamily vacancy rates, which dropped from an all-time high of 13.1 percent at the end of 2009 to 7.0 percent at the end of 2015. Rents followed suit, rising steadily between 2 and 4 percent per year from 2012 to 2020.
-
2023 Q4 Databook
Long-term interest rates have come down from their highs of last year, which should provide some relief to some loans, but many properties and loans still face higher rates, uncertainty about property values and – for some properties – changes in fundamentals. Each loan and property faces a different set of circumstances, which will come into play as the market works through loans that mature this year.
-
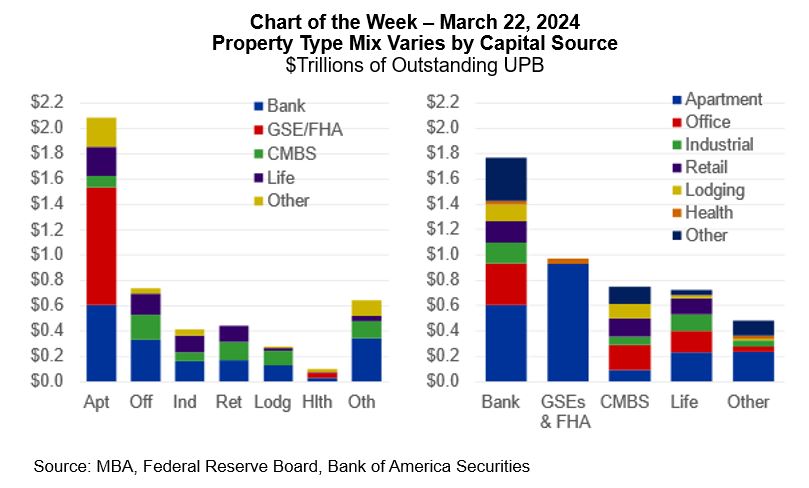 Chart of the Week: Property Type Mix Varies by Capital Source
CRE mortgage debt is not a monolithic market. Rather, it is made up of a broad range of intersections—across property types and capital sources, as well as property subtypes, metro markets and submarkets, owner types, vintages, and more.
-
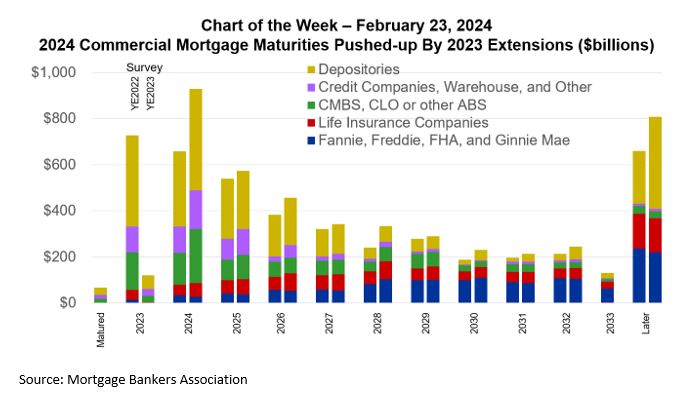 Chart of the Week: 2024 Commercial Mortgage Maturities Pushed Up by 2023 Extensions
A lack of transactions and other activity last year, coupled with built-in extension options and lender and servicer flexibility, has meant that many commercial mortgages that were set to mature in 2023 have been extended or otherwise modified and will now mature in 2024, 2026, 2028 or in other coming years.
-
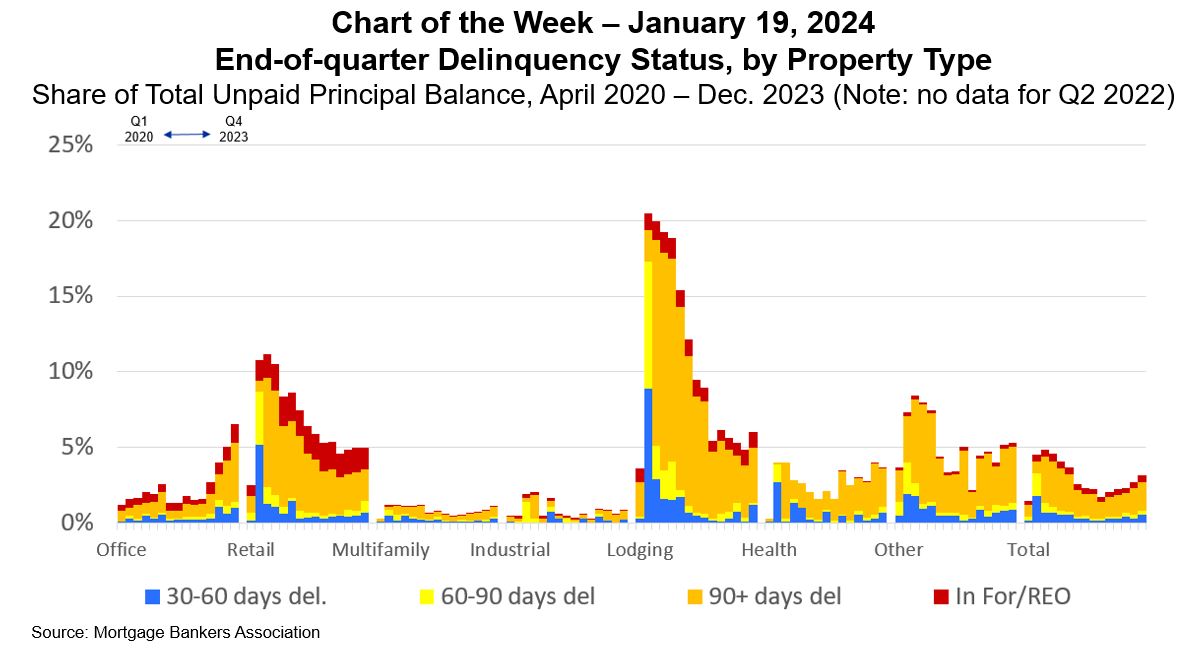 Chart of the Week: End-of-quarter Delinquency Status by Property Type
Ongoing challenges in commercial real estate markets pushed the delinquency rate on CRE-backed loans higher in the final three months of 2023.
-
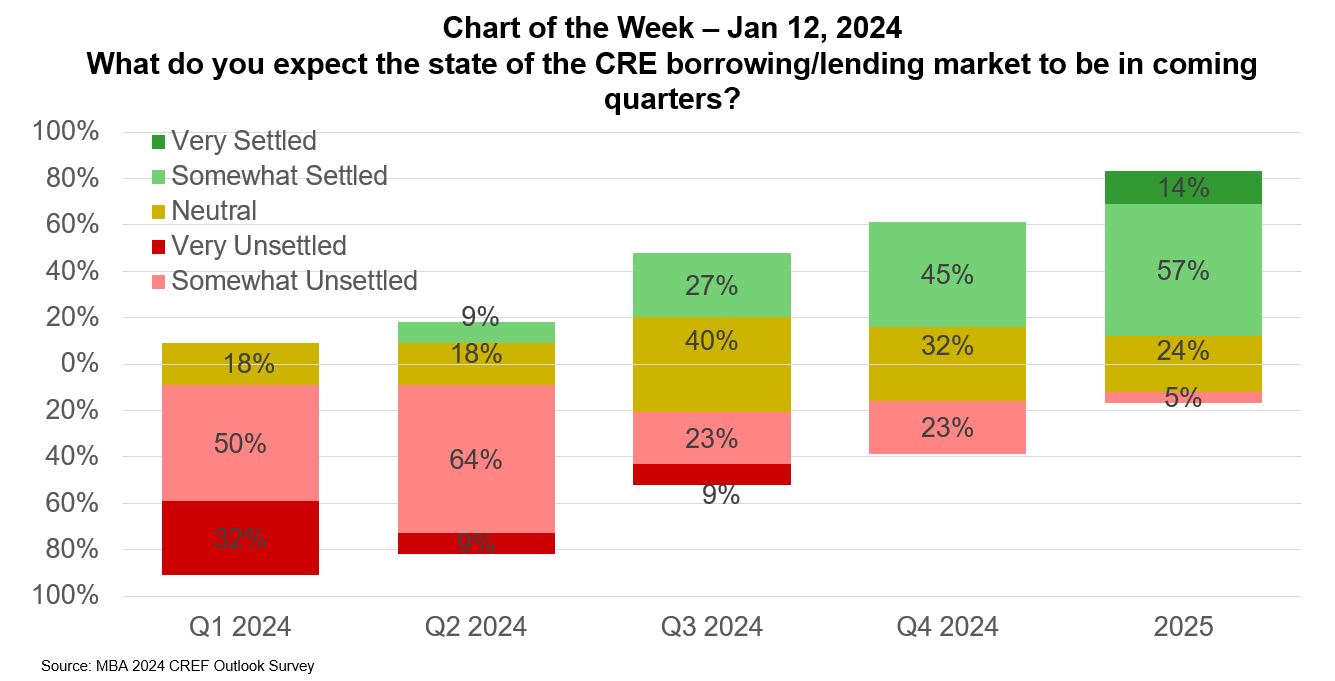 Chart of the Week: What to expect in CRE borrowing/lending
Even though many commercial real estate loans are long-lived, with terms of five, seven, ten, or more years, there’s a sense that the industry starts each year fresh.
-
2023 Q3 Databook
Commercial real estate markets are entering the new year relatively stuck. Through the first three quarters of 2023, property sales and mortgage origination volumes are each down fifty-plus percent compared to the year prior. Questions about some properties’ fundamentals, about where property values sit and about where interest rates may go from here have led to many participants sitting on the sidelines – waiting for greater clarity and perhaps more favorable conditions.
-
 Chart of the Week: CRE Delinquencies and Net YTD Charge-offs at FDIC-insured Firms
Since March of 2023, a recurring set of questions has revolved around a) how conditions in commercial real estate (CRE) are affecting banks and b) how conditions with banks are affecting CRE.
-
2023 Q2 Databook
Commercial real estate is a large and heterogeneous market. Of the $4.6 trillion of commercial mortgage debt outstanding, roughly $2 trillion is backed by multifamily properties, $750 billion by office loans, $420 billion by retail, $360 billion by industrial and $300 billion by hotel, with the remainder in health care, self-storage, mixed use, and a host of other income-producing properties.
-
MBA CREF Forecast - July 2023
Higher and volatile interest rates, uncertainty about property values and questions about some property fundamentals have led to an impasse in commercial real estate (CRE) property sales and mortgage originations activity this year.
-
2023 Q1 Databook
The U.S. economy has slowed, but less than many expected, to start 2023. Tighter credit conditions and an inverted yield curve serve as signs that further slowdowns may be ahead.
-
2023 Q1 Mortgage Debt Oustanding
Every quarter, MBA releases an analysis of the amount of commercial and multifamily mortgage debt outstanding (MDO) detailing the total amount of MDO as well as the holdings of different capital sources. For our Q1 2023 release, we urge users to take the numbers with a grain of salt, or two.
-
 Chart of the Week: Commercial and Multifamily Mortgage Delinquency Rates
Ongoing stress caused by higher interest rates, uncertainty around property values and questions about fundamentals in some property markets are beginning to show up in commercial mortgage delinquency rates.
-
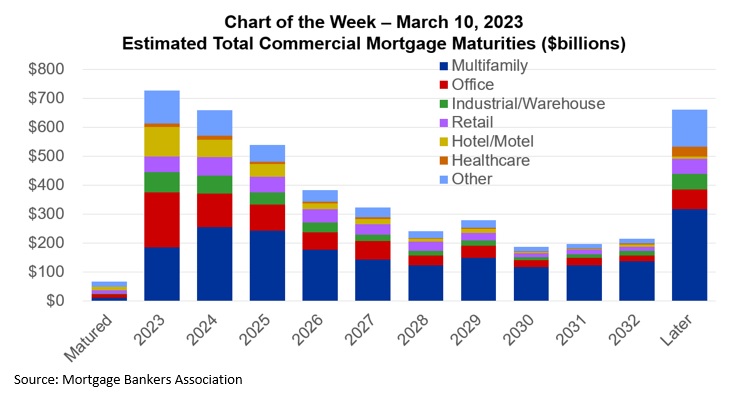 Chart of the Week: Estimated Total Commercial Mortgage Maturities
At MBA’s CREF Convention in San Diego last month, we released the results of our annual survey of upcoming commercial and multifamily mortgage maturities. The survey collects information directly from loan servicers on when the loans they service mature. As in past years, the numbers we released covered loans held by non-bank lenders—including those guaranteed by Fannie Mae, Freddie Mac, and FHA, as well as those held by life companies, included in commercial mortgage-backed securities (CMBS), made by investor-driven lenders like debt-funds, mortgage REITs, and other credit companies. While the information we collect covers essentially all the loans in those groups, it has typically covered only a sample of loans held by banks. This year’s survey, however, collected information on $400 billion of bank-held commercial and multifamily mortgages—23 percent of the outstanding universe. Using this year’s survey results, for the first time we are expanding our loan maturity analysis to include an estimate of the maturity profile of all commercial and multifamily mortgages—including the more than $1.7 trillion on bank balance sheets.
