2024 Q1 Databook
ECONOMY
The US economy continues to show strength, albeit with (long-expected) moderation in some areas.
Real gross domestic product grew at a seasonally adjusted annual rate of 1.3 percent in Q1, down from 2023 growth rates of 2.2 percent in Q1, 2.1 percent in Q2, 4.9 percent in Q3 and 3.4 percent in Q4. Consumer spending on services continued to be a key driver – growing at a 3.9 percent real annual pace during Q1. Consumer spending on goods fell at a 1.9 percent pace.
The labor market continues to expand – with a seasonally adjusted 272,000 jobs added in May, following growth of 165,00 in April, 310,000 in March, 236,000 in February and 256,000 in January. Despite this growth, the unemployment rate (measured in a separate survey) has been trending upward and hitting 4.0 percent in May after ending 2023 at 3.7 percent. Average hourly earnings in May were 4.08 percent higher than a year earlier, following a 3.98 percent year-over-year rise in April. While still strong, those two rates of growth are the lowest since June 2021.
That wage growth has been a key focus of the Federal Reserve in their battle on inflation. After rapidly declining from 9.1 percent in June 2022 to 3.0 percent in June 2023, year-over-year inflation as measured by the consumer price index has been treading water since – coming in at 3.3 percent in May 2023. The overall decline in inflation means that after two years of the opposite being true, wage growth has been outpacing inflation since May 2023.
With inflation moderating and the unemployment rate rising, debate and prognostication about the Federal Reserve’s next steps remains active – both inside and outside the Fed. With four meetings of the Open Market Committee (FOMC) remaining before the end of the year (July, September, November and December), FOMC participants were split in their July forecasts about how many cuts they expect before year-end – with roughly a quarter expecting no cuts, a third expecting one cut and another third expecting two cuts in the Fed Funds Rate. Continuing their theme of being “data dependent,” the result will depend on how the inflation and jobs reports come out in coming months.

PROPERTY FUNDAMENTALS
Commercial real estate (CRE) markets continue to attract outsized attention but the dominant theme in today’s market is that CRE property markets are widely diverse and that broad brushstrokes do not apply.
Office
Office property markets continue to attract the greatest focus, particularly as return-to-office policies evolve. According to JLL, “The first quarter of 2024 brought mixed results for the U.S. office market—while the macroeconomic picture and occupier demand are improving, negative net absorption remains stubbornly high as major occupiers continue to trim meaningful amounts of space from their portfolios. But despite persistent downsizing, the market is being rebalanced through a robust conversion and redevelopment pipeline that has grown at a near exponential pace over the short term.”

As always, conditions vary by market, and significantly by submarket and by building. A recent analysis by CBRE found that the very top-quality buildings are dramatically outperforming the rest of the market.
As the office market evolves, investors and others are gaining a sharper understanding of which properties are more—and less – affected by demand challenges and therefore which ones can support additional investment and capital. That being said, we are likely closer to the start of working through the changes than the end.
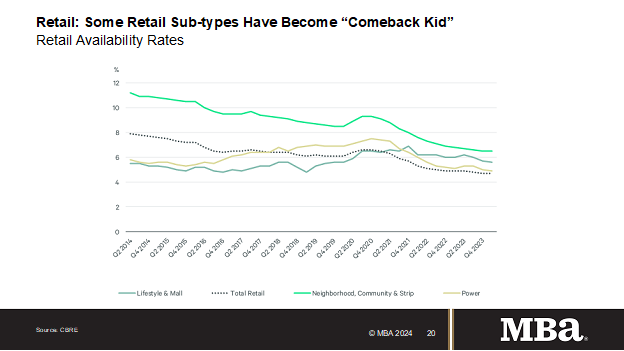
Retail
Retail markets have shown far greater stability. CBRE reports that “The overall retail availability remained at 4.7% in Q1 despite supply additions outpacing net absorption. Net absorption fell to 3.7 million sq. ft. in Q1 from 12.5 million sq. ft. in the previous quarter and was less than half of the 10-year quarterly average. Store closures were the primary reason for the dramatic decline. High construction costs kept new retail development at a low level, with completions totaling 5.8 million sq. ft., down by 32% from the previous quarter.”
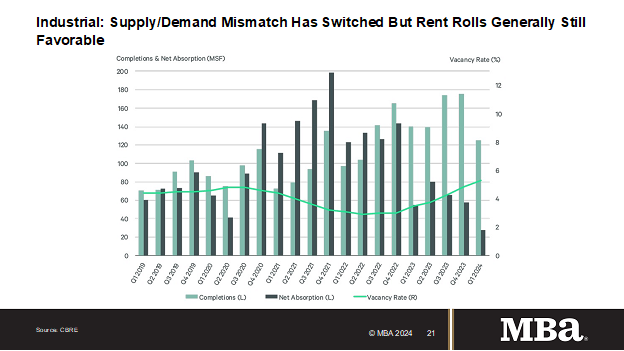
Industrial
The industrial market is adjusting from a period during which demand far outstripped supply to one in which new supply is increasing vacancies and putting downward pressure on rent growth.
During the Company’s Q1 earnings call, Prologis’ Chief Financial Officer noted, “Net absorption in the US, for example, was very low this quarter at just 27 million square feet. So, while the macro landscape and supply chains continue to generate a need for space, we think it's prudent to expect continued headwinds on overall absorption over the next few quarters. The interest rate environment and its associated volatility have weighed on customer decision making, especially as the 10-year [Treasury] has increased 70 basis points from its level just 90 days ago and expectations for Fed rate cuts have moved from potentially six to now possibly zero. In parallel, sublease and space utilization rates highlight that some customers have available capacity, driven in part by the high rate of absorption through the pandemic.”
Multifamily
Similar to industrial, the multifamily property market is adjusting after a period during which demand outpaced supply, which drove vacancy rates lower and rent growth into double-digits.
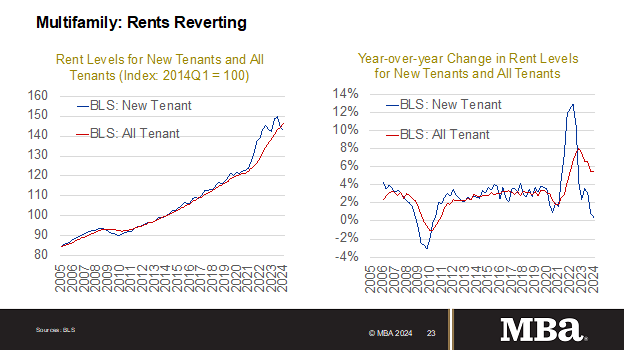
That trend has at least partially reversed, with more than 900,000 multifamily units currently under construction and units coming online at a pace of roughly 500,000 units per year. The impact of those new units, coupled with the rise in interest rates and uncertainty around property valuations, has pulled the level of new permitting and starts down from recent highs. Where those new supply levels balance out will be a key determinant of market conditions 18-plus months from now, when units started today are coming online.

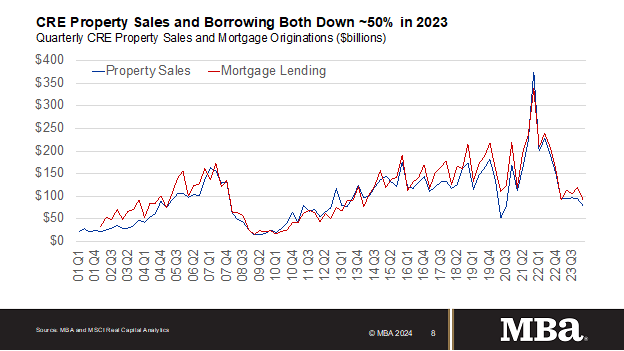
SALES AND VALUES
Sales of commercial real estate properties in 2023 were 52 percent lower than they had been in 2022. Continuing the malaise, Q1 2024 sale volumes were 13 percent lower than they had been a year earlier. The trend persisted into May, with that month’s sales down 37 percent from a year earlier and year-to-date activity down 39 percent.
The lack of transaction volume makes tracking property prices and values challenging. Compared to their July 2022 levels, Q1 2024 CRE prices were 9.5 percent lower according to a series used by the Federal Reserve, 12.1 percent lower according to MSCI’s Real Capital Analytics and17.4 percent lower according to Green Street Advisors. Each series has a slightly different approach and focus, but the lack of transaction activity has added uncertainty to all.
Even with that, though, CRE values are generally up from a decade ago. The MSCI Real Capital Analytics series show May 2024 property values up from a decade earlier by 129 percent for industrial, 88 percent for apartments, 25 percent for retail and 13 percent for office.

MORTGAGE ORIGINATIONS
Total commercial real estate (CRE) mortgage borrowing and lending is estimated to have totaled $429 billion in 2023, a 47 percent decrease from the $816 billion in 2022, and a 52 percent decrease from the record $891 billion in 2021. Excluding activity from smaller and mid-sized depositories not directly captured, MBA’s survey tracked $306 billion of loans closed by dedicated commercial mortgage bankers in 2023 -- 49 percent less than the $595 billion reported in 2022.
Higher interest rates, uncertainty about property values, and questions about some properties’ fundamentals led to a steep fall-off in borrowing and lending backed by commercial real estate last year. The declines were broad-based, covering every major property type and capital source. The sustained growth in the amount of CRE mortgage debt outstanding signals that much of the drop in originations was driven by a decline in borrower demand stemming from slowdowns in sales transactions and refinances. If property owners had the ability to sit pat, they generally did.
Among different property types, multifamily properties saw the highest volume last year, with an estimated $264 billion of total lending and $178 billion directly tracked by dedicated mortgage bankers. First liens accounted for 96 percent of the mortgage bankers’ dollar volume closed.
Dedicated mortgage banking firms reported closing $306 billion of CRE loans in their own names and serving as intermediaries on $225 billion. Firms reported serving as investment sales brokers for $225 billion of deals.
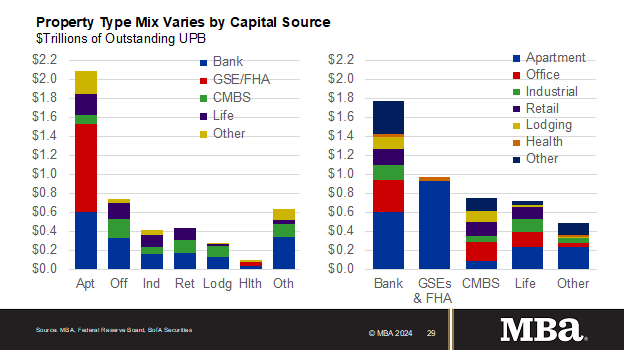
Depositories were the leading capital source of CRE mortgage debt, followed by life insurance companies and pension funds, government-sponsored enterprises (Fannie Mae and Freddie Mac), private label CMBS, and investor-driven lenders.
All indications are that 2024 is off to a slow start as well.
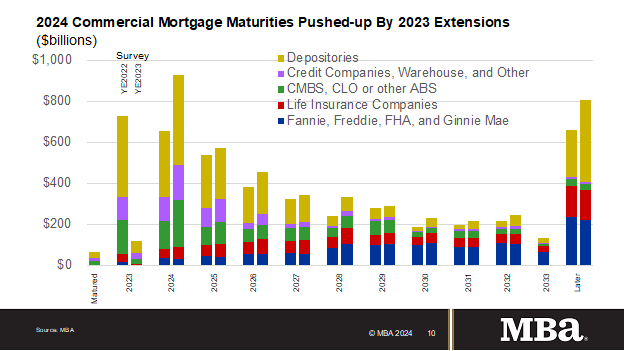
Borrowing and lending backed by commercial real estate properties remained muted in the first quarter of 2024. Higher interest rates are continuing to act as a deterrent to action for many property owners, but more than $900 billion of mortgage maturities this year – coupled with potential acquiescence to those higher rates – are likely to bring some additional deals to the market this year.
Originations in the first quarter of 2024 varied across the different property types. There was a 31 percent year-over-year decrease in the dollar volume of loans for retail properties, a 22 percent decrease for health care properties, a 21 percent decrease for office properties, and a 7 percent decrease for multifamily properties. Hotel property originations increased 8 percent and there was a 63 percent increase for industrial properties.

Among investor types, the dollar volume of loans originated for depositories decreased by 41 percent year-over-year. There was a 17 percent decrease for government sponsored enterprises (GSEs – Fannie Mae and Freddie Mac) loans, but a 35 percent increase in life insurance company loans, a 41 percent increase for investor-driven lender loans, and a 93 percent increase in the dollar volume of commercial mortgage-backed securities (CMBS) loans.
With loan maturities and other triggers increasingly likely to prompt action, property owners, potential owners, lenders, and others are all working through the specifics of each individual property to identify the level of mortgage debt that property can support. New loan originations should follow as this continues.
MORTGAGE DEBT OUTSTANDING
The amount of commercial mortgage debt outstanding increased in the first quarter of 2024, despite slow mortgage originations activity. Every major capital source increased its holdings of commercial mortgages, as fewer loans than usual were paid off through property sales or refinancings.
The level of commercial/multifamily mortgage debt outstanding increased by $40.1 billion (0.9 percent) in the first quarter of 2024 to $4.70 trillion. Multifamily mortgage debt alone increased $23.7 billion (1.1 percent) to $2.10 trillion from the fourth quarter of 2023.
In the first quarter, bank and thrifts saw the largest gains in dollar terms in their holdings of commercial/multifamily mortgage debt – an increase of $12.8 billion (0.7 percent). CMBS, CDO and other ABS issues increased their holdings by $11.0 billion (1.9 percent), agency and GSE portfolios and MBS increased their holdings by $10.2 billion (1.0 percent), and life insurance companies increased their holdings by $7.0 billion (1.0 percent).
The $23.7 billion increase in multifamily mortgage debt outstanding from the fourth quarter of 2023 represents a quarterly gain of 1.1 percent. In dollar terms, agency and GSE portfolios and MBS issues saw the largest gain – $10.2 billion (1.0 percent) – in their holdings of multifamily mortgage debt. Bank and thrifts increased their holdings by $9.1 billion (1.5 percent), and life insurance companies increased by $3.8 billion (1.7 percent).
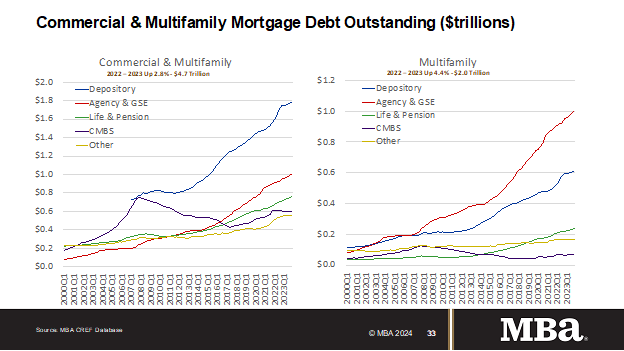
Commercial banks continue to hold the largest share (38 percent) of commercial/multifamily mortgages at $1.8 trillion. Agency and GSE portfolios and MBS are the second-largest holders of commercial/multifamily mortgages (22 percent) at $1.01 trillion. Life insurance companies hold $720 billion (15 percent), and CMBS, CDO and other ABS issues hold $604 billion (13 percent).
Looking solely at multifamily mortgages in the first quarter of 2024, agency and GSE portfolios and MBS hold the largest share of total multifamily debt outstanding at $1.01 billion (48 percent), followed by banks and thrifts with $620 billion (30 percent), life insurance companies with $230 billion (11 percent), state and local government with $117 billion (6 percent), and CMBS, CDO and other ABS issues holding $67 billion (3 percent).
LOAN PERFORMANCE
While overall delinquencies remained flat, the delinquency rate for loans backed by office properties rose again during the first three months of this year. Loans across property types are adjusting to higher interest rates and uncertainty about property values, but the continued fog around the impact of hybrid work adds another challenge for office properties and their loans.
The commercial real estate market is large and diverse, with a wide mix of property types, geographic markets and submarkets, property and loan sizes, owners, lenders, vintages, and other characteristics. With 20 percent of the $4.7 trillion of outstanding commercial mortgage debt maturing this year, each of those factors will play a part in determining which loans may face challenges and which may not.
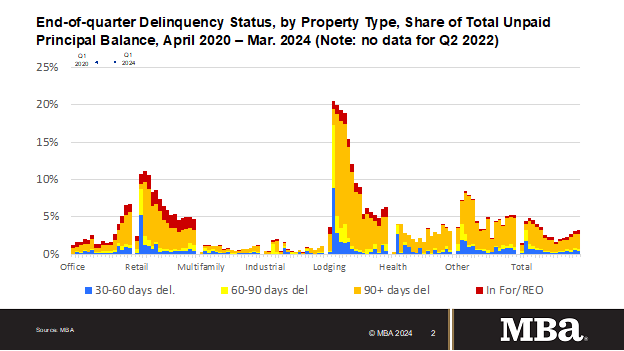
The balance of commercial mortgages that are not current was unchanged in first-quarter 2024 (compared to Q4 2023).
- 96.8% of outstanding loan balances were current or less than 30 days late at the end of the quarter, unchanged from the previous quarter.
- 2.5% were 90+ days delinquent or in REO, up from 2.3% the previous quarter.
- 0.3% were 60-90 days delinquent, unchanged from the previous quarter.
- 0.4% were 30-60 days delinquent, down from 0.6%.
Loans backed by office properties drove the increase.
- 6.8% of the balance of office property loan balances were 30 days or more days delinquent, up from 6.5% at the end of last quarter.
- 6.3% of the balance of lodging loans were delinquent, up from 6.1%.
- 4.7% of retail balances were delinquent, down from 5.0% the previous quarter.
- 1.2% of multifamily balances were delinquent, unchanged from the previous quarter.
- 1.2% of the balance of industrial property loans were delinquent, up from 0.9%.
It is important to recognize that different capital sources track delinquencies in different ways – and with good reason. The rise in delinquency rates for commercial mortgages at banks was driven by banks designating non-multifamily loans – in particular, office – as ‘nonaccrual,’ meaning the loan may still be current on payments, but the lender does not expect to be paid in full. The increases in such loans, and the associated net-charge-offs at large banks, can be seen as evidence of the institutions working to get ahead of potential future defaults.

Based on the unpaid principal balance (UPB) of loans, delinquency rates for each group at the end of the first quarter of 2024 were as follows:
- Banks and thrifts (90 or more days delinquent or in non-accrual): 1.03 percent, an increase of 0.09 percentage points from the fourth quarter of 2023;
- Life company portfolios (60 or more days delinquent): 0.52 percent, an increase of 0.16 percentage points from the fourth quarter of 2023;
- Fannie Mae (60 or more days delinquent): 0.44 percent, a decrease of 0.02 percentage points from the fourth quarter of 2023;
- Freddie Mac (60 or more days delinquent): 0.34 percent, an increase of 0.06 percentage points from the fourth quarter of 2023; and
- CMBS (30 or more days delinquent or in REO): 4.35 percent, an increase of 0.05 percentage points from the fourth quarter of 2023.